Living Network: watching zero trust decide, one hop at a time
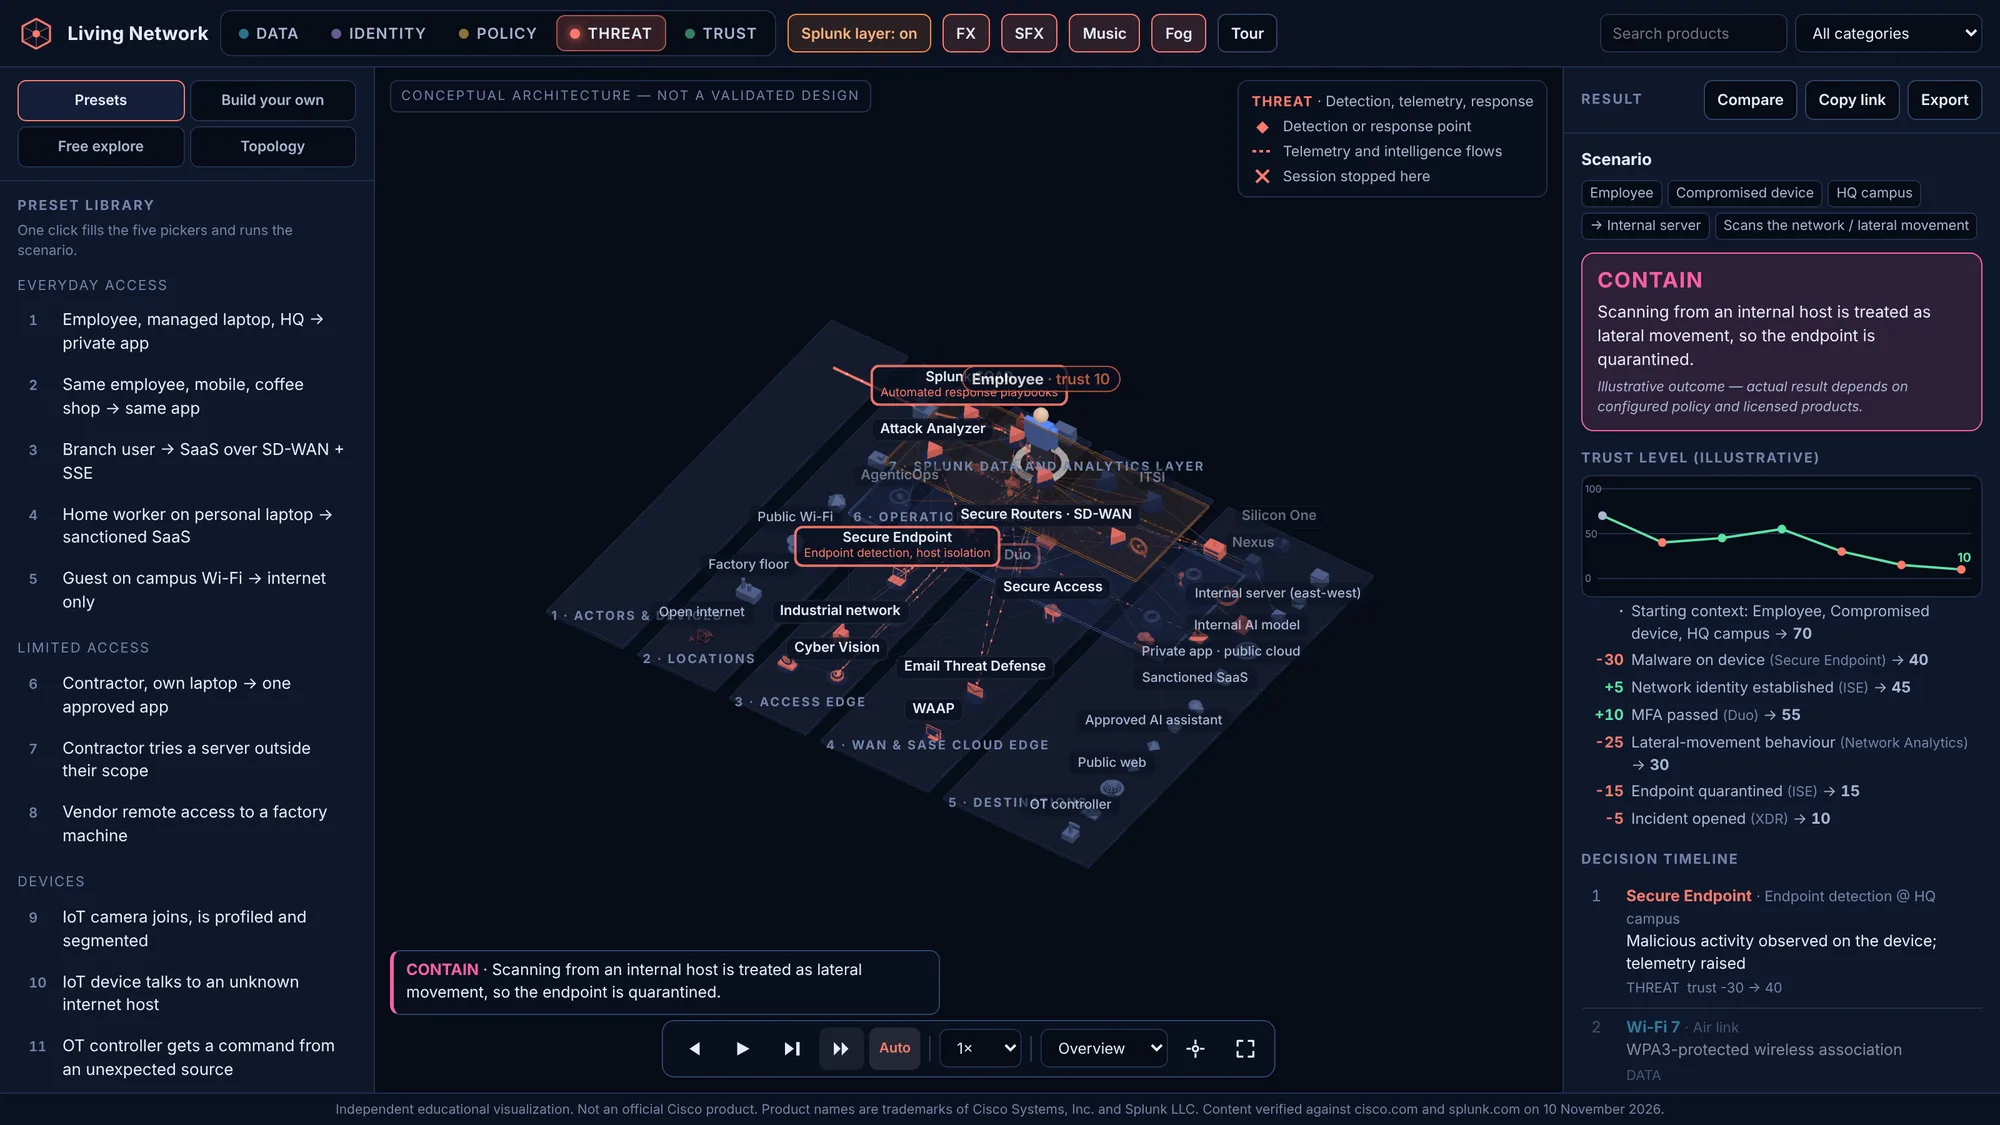
A compromised laptop scans the campus. Secure Network Analytics spots it, ISE quarantines the endpoint, XDR opens an incident.
Most diagrams of a security architecture show you the boxes. They rarely show you what happens when someone actually tries to get somewhere.
I wanted something I could put in front of a partner or a customer and say: pick who is asking, on what device, from where, going where, and doing what. Then press play and watch. So I built Living Network, an interactive 3D explainer of how Cisco networking and security products work together.
The numbers
It ships with 30 ready-made presets, but the builder goes much further. There are 10 actors, 8 devices, 7 locations, 13 destinations and 18 behaviours to choose from. After ruling out the combinations that make no sense (a guest on a managed laptop, a factory robot checking email), that leaves:
- 1,806 valid combinations of who, device, location and destination
- about 27,000 scenarios if you add one behaviour at a time
- more than 18.6 million distinct scenarios once behaviours are combined
Every one of them produces a path, a decision timeline and a verdict. Behind that sit 40 products, 115 relationships between them, each linked to the public page that states it, and 103 rules that decide what happens at each checkpoint.
What it does
You compose a scenario from five pickers, or choose a preset: an employee on a managed laptop, a contractor on their own device, an IoT camera, an attacker with a stolen password. A small figure walks the path through the network. At each checkpoint the product responsible says what it checked and what it found. A trust level rises and falls as signals change, and the run ends in one of five verdicts: allow, allow with limits, step-up, block, or contain.
A few things I'm pleased with:
- Five lenses on one scene. Data, Identity, Policy, Threat and Trust recolour the same map, so you can see where traffic is encrypted, where identity is verified, and where policy is written versus enforced.
- "Without these controls." Remove a product, or a whole suite, and replay. It shows the gap better than any slide.
- Topology mode. Isolate one of 14 architecture views, such as SASE or Hybrid Mesh Firewall, and see each relationship numbered with its source.
- A Splunk layer you can switch on to see where logs, detection and automated response fit.
- Three camera views, including third person behind the actor, with fog of war so the next hop stays hidden until you reach it.
How I kept it honest
This was the part I cared about most. Every product description and every line between two products comes from a public page on cisco.com, splunk.com or Splunkbase, and each one links to its source. If I couldn't find a relationship stated publicly, I didn't draw it.
It is still a teaching tool. The verdicts show a typical zero-trust outcome, not guaranteed product behaviour, and the page says so next to every result.
How it's built
One HTML file. No build step, no backend, no tracking. Three.js for the scene, and every sound is synthesised in the browser. All the products, rules and scenarios live in one data object, so adding a scenario is a data edit. I built it with Claude Code over a few days of back-and-forth.
Independent educational project. Not an official Cisco product. Product names are trademarks of their owners.